Reflections in Adobe Illustrator and XAML
If you ever wanted to create a reflection like those found on the Web 2.0 Logo Creator by Alex P, I have documented the steps here.

Basically, the steps are simple and the approach is strikingly similar in both Adobe Illustrator and XAML. First, I’ll explain how to do it in AI.
- Create some kind of graphic and group all of the objects together.
- Make a copy of this graphic and move it directly below your original. You can use the Align tools to make sure the new one is directly below your exising artwork or you can use the Transform palette to be precise about the x, y, width, and height of your new object
- Create a rectangle with the exact same width and height of your new object and place it dorectly over your new object. Use the Align or Transform palettes to help you do this precisely.
- Place a gradient fill, going down from white to black in this new rectangle.
- Select both the rectangle and your new, copied object.
- In the Transparency palette, click on the “Make Opacity Mask”
- Viola!

Doing the same thing in XAML is just as easy, but with an extra ultra-cool twist. What I want to do this time is mirror a graph, this one:

Creating the graph is pretty easy. I used Expression Interactive Designer and just drew the lines, changing their colors on a whim. The resulting XAML is easy.
<
Canvas Margin="0,0,0,0" x:Name="canvas" Width="420" Height="122" Background="#FFFFFFFF"><
Path Stroke="#FF000000" Width="420" Height="122" Data="M0.50000001,0.5 L26.662557,43.311456 54.01432,62.33877 82.555291,42.122249 118.2315,40.933042 178.88107,43.311456 202.66521,51.635906 222.88173,56.392735 269.26081,71.852427 316.82909,76.609256 346.55927,46.879078 370.34341,26.662557 389.56465,21.554452 409.78117,28.689695 416.72249,18.338107" Canvas.Left="1.28546878695488" Canvas.Top="18.3114880025387" /><
Path Stroke="#FFFF0000" Width="420" Height="122" Data="M1.7854688,18.811488 L29.137232,17.622281 52.921375,27.135938 81.462346,24.757524 110.00332,30.703559 175.40971,11.676246 202.76146,5.73021 217.03195,41.406425 259.8434,41.406427 305.03327,43.784842 335.95266,29.514355 350.22315,16.433075 388.27777,14.054661 408.49429,21.189904 421.57557,22.379112" /><
Path Stroke="#FF00FF00" Width="420" Height="122" Data="M0.50000001,5.256827 L27.755502,42.838074 51.635906,13.581277 83.648237,51.162524 108.71785,17.148898 174.02798,23.81076 200.19053,57.108559 220.40705,69.000631 256.08327,67.811424 310.7868,51.162524 332.19252,33.324417 348.93768,2.878414 386.9923,0.49999999 407.20882,7.635243 420.2901,8.824451" /></
Canvas>
Lots of data points, but nothing to be afraid of. Just a canvas and three paths. I then stick this in a StackPanel so my mirrored graph can appear right below the normal graph.
<StackPanel Width="420" HorizontalAlignment="Center">
<Canvas Margin="0,0,0,0" x:Name="canvas" Width="420" Height="122" Background="#FFFFFFFF">…</Canvas>
<Canvas Margin="0,2,0,0" Width="420" Height="122">…</Canvas>
</StackPanel>
Now, I want to paint t he lower canvas with a VisualBrush. Notice that the upper canvas has a name, “x:Name=”canvas”. When I paint the lower canvas with a VisualBrush, I name “canvas” as the Binding ElementName, like so:
Canvas Margin="0,2,0,0" Width="420" Height="122"><
<Rectangle Width="420" Height="122">
<Rectangle.Fill>
<VisualBrush Visual="{Binding ElementName=canvas}"/>
</Rectangle.Fill>
</Rectangle>
</Canvas>
I then need to flip the VisualBrush, this is easy with a simple ScaleTransform passing -1 to ScaleY
<Canvas Margin="0,2,0,0" Width="420" Height="122">
<Rectangle Width="420" Height="122">
<Rectangle.Fill>
<VisualBrush Visual="{Binding ElementName=canvas}">
<VisualBrush.RelativeTransform>
<TransformGroup>
<ScaleTransform CenterX="0.5" CenterY="0.5" ScaleX="1" ScaleY="-1"/>
</TransformGroup>
</VisualBrush.RelativeTransform>
</VisualBrush>
</Rectangle.Fill>
</Rectangle>
</Canvas>
Finally, we need to add the Opacity Mask like we did for the Illustrator object. In XAML, instead of a filled rectangle, we specify an OpacityMask on the existing rectangle, like so:
<Canvas Margin="0,2,0,0" Width="420" Height="122">
<Rectangle Width="420" Height="122">
<Rectangle.Fill>
<VisualBrush Visual="{Binding ElementName=canvas}">
<VisualBrush.RelativeTransform>
<TransformGroup>
<ScaleTransform CenterX="0.5" CenterY="0.5" ScaleX="1" ScaleY="-1"/>
</TransformGroup>
</VisualBrush.RelativeTransform>
</VisualBrush>
</Rectangle.Fill>
<Rectangle.OpacityMask>
<LinearGradientBrush StartPoint="0,0" EndPoint="0,1" >
<GradientStop Color="#44000000" Offset="0"/>
<GradientStop Color="#00000000" Offset="1"/>
</LinearGradientBrush>
</Rectangle.OpacityMask>
</Rectangle>
</Canvas>
That’s it, our final product looks like so:
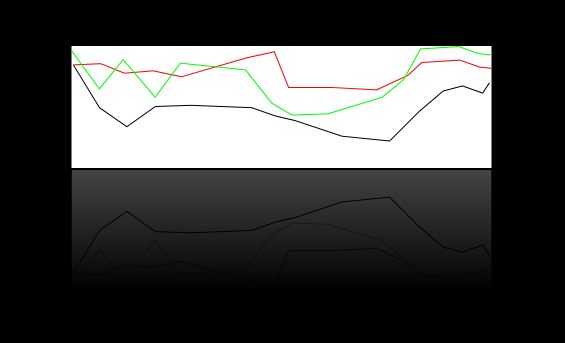
So, what’s the extra cool twist with doing this in XAML? Using the interaction designer, once you set up the VisualBrush, the bottom reflection responds in real-time as you manipulate the source of the Visual Brush! Don’ you get it?! It’s incredible.
If you are not as excited as me, write me and perhaps I’ll do a titillating screencast.
Comments
While I do think that this is cool to do this in the designer and see it updated in real time, don't you get the same effect to some degree with Smart Objects in Illustrator?
Posted by: Nicholas Paldino [.NET/C# MVP] | September 14, 2006 5:20 PM